 Koboshi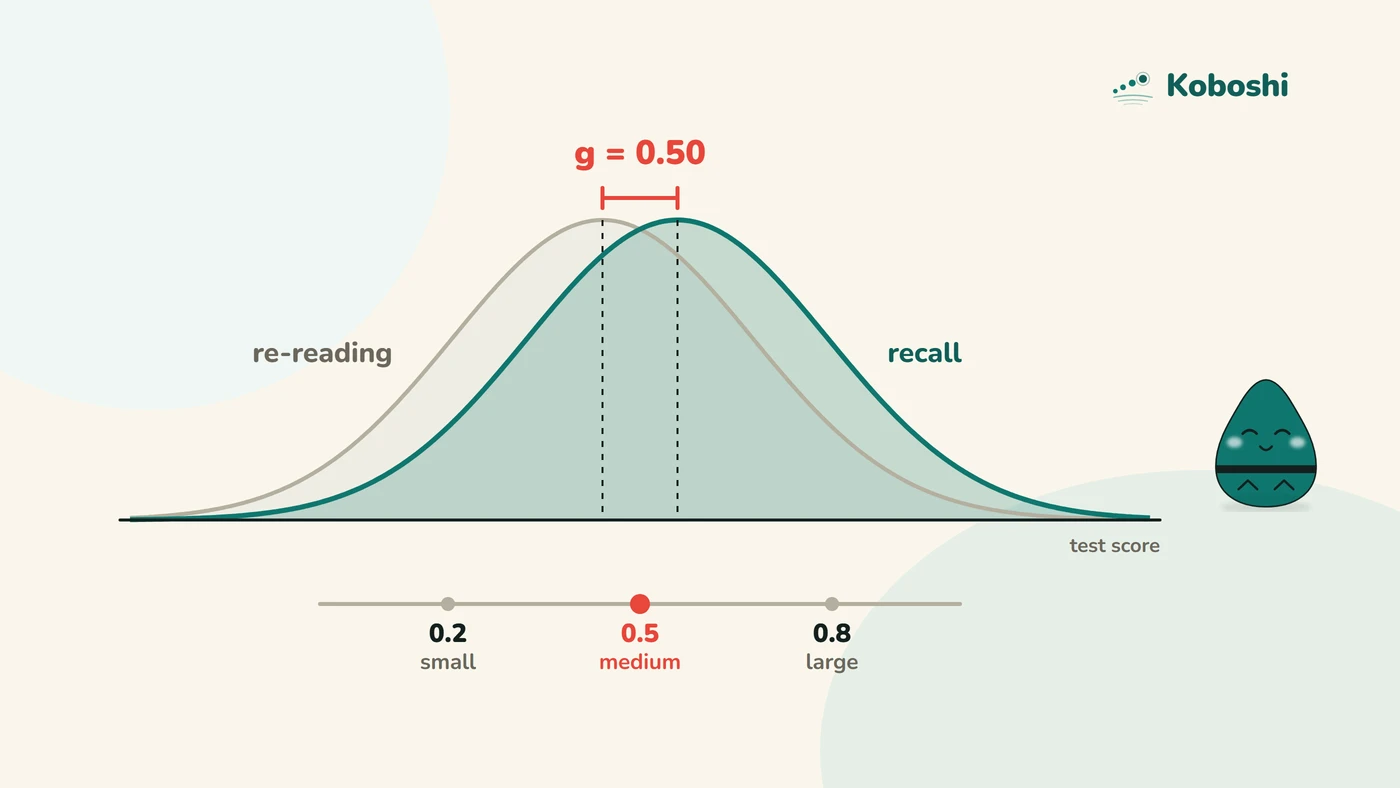
Our articles cite real studies, and studies report their results with letters like g and d. Researchers read them at a glance; most people were never told what they mean. Here is the whole explanation, no statistics course required.
The question g and d answer: how big is the difference?
Imagine two classes learning Spanish words. One reviews by re-reading the list. The other covers the list and tries to recall each word. A month later, the recall class scores higher on the same test. The question that matters: higher by a lot, or by a hair?
g and d measure exactly that: the gap between two groups, in a standard unit, so studies of different sizes can be compared fairly. The two letters are nearly the same thing; g just includes a small correction that keeps small studies honest. One ladder covers both:
| Value | Reads as | In plain words |
|---|---|---|
| around 0.2 | small | real, but you would not notice without measuring |
| around 0.5 | medium | you would notice it in practice |
| around 0.8 and up | large | obvious, visible from across the room |
So when we cite “retrieval practice beats re-reading, g = 0.50”, it means: a solid, medium-sized advantage, the kind you would actually feel over a month of studying.
Two habits for reading these numbers like a pro. First, a very large value (say d = 1.4) usually comes from pooling many different studies, so read it as “works well”, not “you will improve by exactly this much”. Second, size of the study matters: a result from 36 learners is a hint; a result combining 159 comparisons is a finding. Our articles prefer the second kind, and say so when a claim rests on thin evidence.